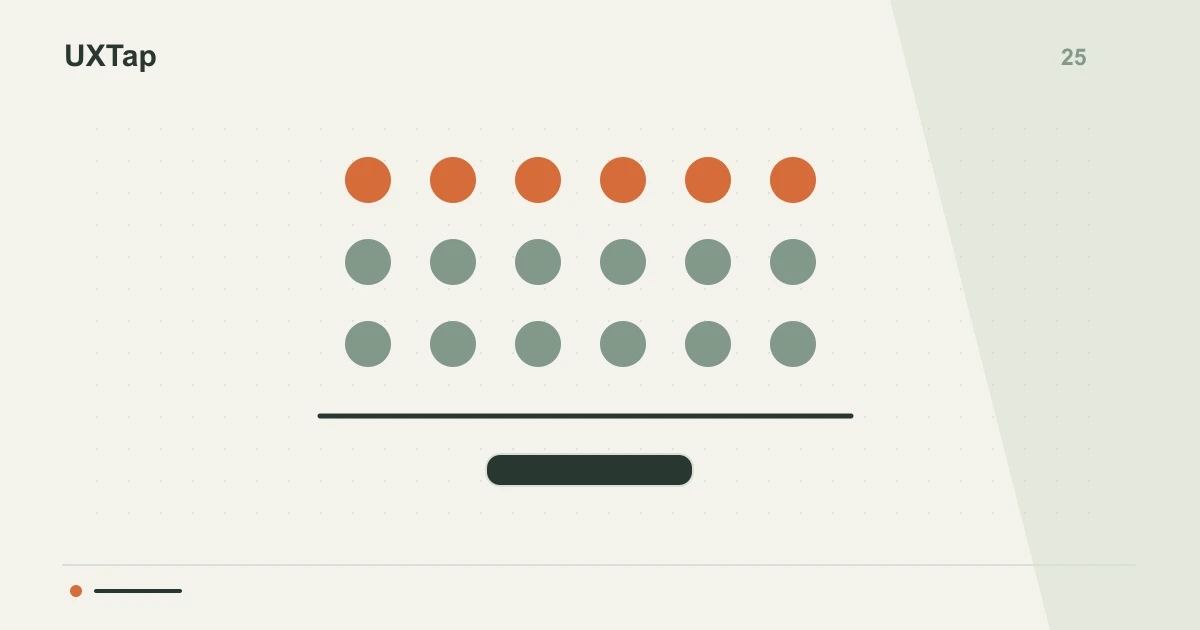
A percentage without a description of the total leaves an essential question unanswered: who are we talking about? In a hypothetical example, “80% completed” might describe people who started a task or everyone invited to the study. Showing the numerator, denominator, and inclusion rule makes the measured outcome and the scope of the conclusion understandable.
The foundation of percentages
When analyzing research data, percentages are powerful, but their value directly depends on the denominator – the total number of items or participants that make up the whole. Without this reference, 50% could mean 5 out of 10 or 500 out of 1000, with very different implications for interpreting the results. Always ask, "50% of what?". Denominator clarity allows for inspecting data relevance.
Multiple choice and over 100%
In multiple-choice questions where participants can select several options, the sum of percentages can exceed 100%. For example, if 60% choose "A" and 70% choose "B", it means many selected both. The denominator here is the total respondents, not the total responses. For task completion rates, the denominator is the total attempts or users exposed to the task.
Hypothetical example: app sign-up
Imagine, hypothetically, 10,000 visits to a sign-up screen, 200 starts, and 150 completed registrations. Completion among starts is 150 out of 200, or 75%. Completion per screen visit is 150 out of 10,000, or 1.5%. Neither is the “more real” rate: they answer different questions. Label the event and counting unit, especially if visits include the same person more than once. Do not mix counts of people and events without explaining that choice to the reader.
Check the denominator
- Always include the total number (denominator) alongside the percentage.
- Specify what the denominator represents (respondents, attempts, etc.).
- Be aware that multiple choices can sum to over 100%.
To ensure your analyses are clear, review a recent research report. Identify all percentages and explicitly add the corresponding denominator, explaining what it represents. This will allow your team to inspect the data with greater precision and make more informed decisions.
Your next discovery begins with a question.
Test an idea, observe the experience and bring evidence to your team.
Create my first studyFree · 1 study · 50 responses/month · no card